University admission score distribution: Most exam groups have an average score above 15.
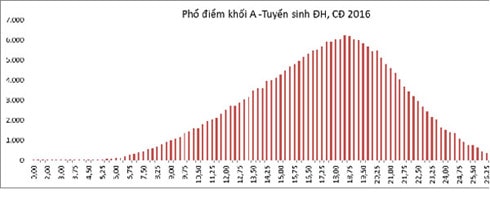
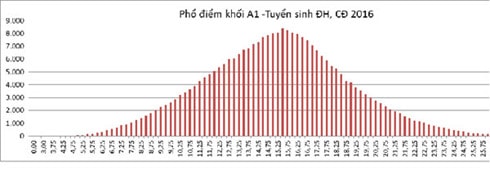
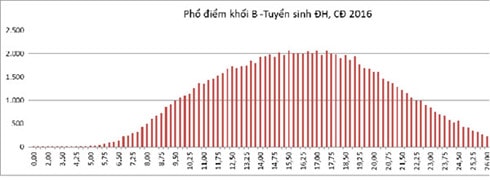
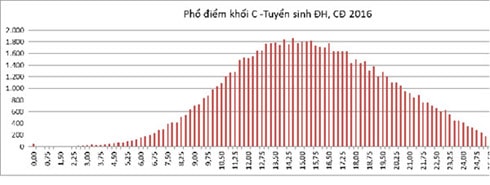
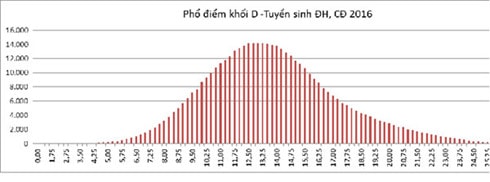
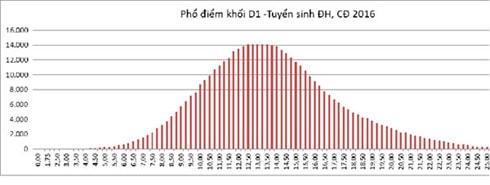
The score distribution results show that exam blocks D and D1 have an average score below 15, block C has an average score of approximately 15, and the remaining blocks are all above 15 points.
The Ministry of Education and Training has just announced the score distribution of exam subjects and the score distribution of traditional exam groups A, A1, B, C, D, D1 of candidates registering for university and college admission (taking the exam at 70 exam clusters chaired by universities) for schools and candidates to refer to in the upcoming university and college admission registration.
The results show that except for exam blocks D, D1 with average scores below 15, and block C with average scores of approximately 15, the remaining exam blocks all have average scores above 15. This is because the score distribution of natural subjects such as Math, Physics, Chemistry is skewed towards high scores while the score distribution of English is skewed towards low scores. The score distribution curves are very even and not steep, creating favorable conditions for schools to determine admission scores appropriate to their targets.
>> See the score distribution of the 2016 university entrance exam groups here
I. Score distribution of candidates' exam subjects at 70 exam clusters chaired by the University
1. Math
Total number of registered university and college exams - Math | 569 681 |
Highest score | 10 |
Number of posts reaching the highest level | 8 |
Number of articles scored between 9-10 | 5 438 (0.95%) |
Average score | 5.02 |
Median | 5.25 |
Points with most | 6.25 |
 |
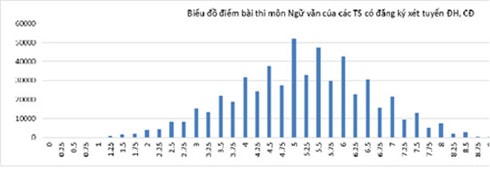
2. Literature
Total number of registered university and college exams - Literature | 554 861 |
Highest score | 9.5 |
Number of posts reaching the highest level | 14 |
Number of articles scored between 9-10 | 434 (0.08%) |
Average score | 5.15 |
Median | 5.25 |
Points with most | 5.00 |
 |
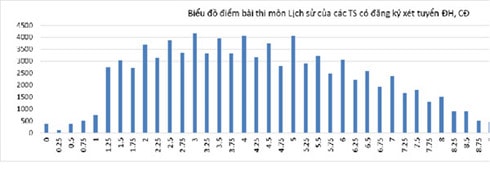
3. History
Total number of registered university and college exams - History | 87 376 |
Highest score | 10 |
Number of posts reaching the highest level | 5 |
Number of articles scored between 9-10 | 877 (accounting for 1.00%) |
Average score | 4.32 |
Median | 4.25 |
Points with most | 3.00 |
 |
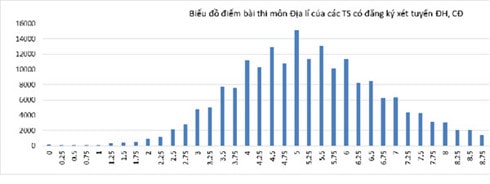
4. Geography
Total number of registered university and college exams - Geography | 191 810 |
Highest score | 10 |
Number of posts reaching the highest level | 9 |
Number of articles scored between 9-10 | 2,425 (1.26%) |
Average score | 5.27 |
Median | 5.25 |
Points with most | 5.00 |
 |
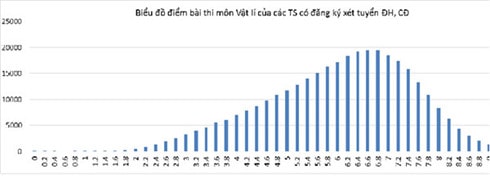
5. Physics
Total number of registered university and college exams - Physics | 341 982 |
Highest score | 10 |
Number of posts reaching the highest level | 14 |
Number of articles scored between 9-10 | 2 516 (0.74%) |
Average score | 6.02 |
Median | 6.20 |
Points with most | 6.60 |
 |
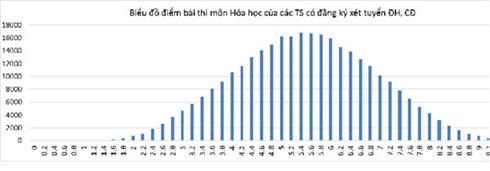
6. Chemistry
Total number of registered university and college exams - Chemistry | 313 317 |
Highest score | 10 |
Number of posts reaching the highest level | 15 |
Number of articles scored between 9-10 | 1,479 (0.47%) |
Average score | 5.48 |
Median | 5.40 |
Points with most | 5.40 |
 |
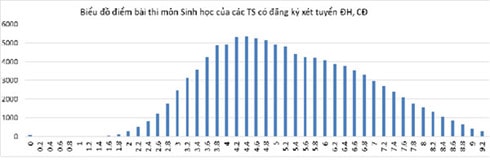
7. Biology
Total number of registered university and college exams - Biology | 108 705 |
Highest score | 10 |
Number of posts reaching the highest level | 6 |
Number of articles scored between 9-10 | 971 (0.89%) |
Average score | 5.26 |
Median | 5.20 |
Points with most | 4.40 |
 |
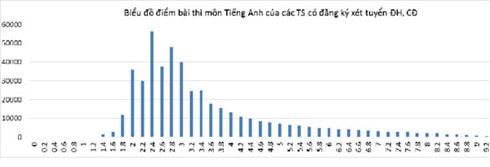
8. English
Total number of registered university and college exams - English | 472 000 |
Highest score | 10 |
Number of posts reaching the highest level | 10 |
Number of articles scored between 9-10 | 2 444 (accounting for 51.78%) |
Average score | 3.48 |
Median | 3.00 |
Points with most | 2.40 |
 |
II. Score distribution of exam blocks A, A1, B, C, D, D1 of candidates taking the exam at 70 exam clusters chaired by the University
 |
 |
 |
 |
 |
 |
According to VOV
