Nghe An and the urgency of building a flood map
(Baonghean.vn) - In Nghe An, almost every year, from the beginning of mid-September to the end of November, there is a season of heavy rain, big floods, and storms that continuously appear, causing unpredictable and unavoidable consequences.
On average, Nghe An has a total rainfall of 2000 - 2200mm each year, of which the rainfall during the rainy season from September to November accounts for 65 - 70% of the total annual rainfall. In particular, there are rains in September and early October of up to 700 - 800mm in a very short time, causing widespread flooding.
According to the forecast of the Central Hydrometeorological Department, this year's storm season in the North Central region alone (including Nghe An) will have about 8-10 storms, of which 3-4 storms are likely to directly affect the mainland, but they will appear late and the most worrying isstrong storms (super storms), extreme, difficult to predict, unpredictable
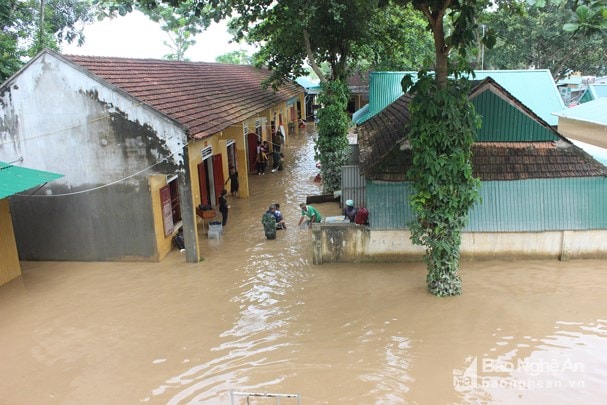 |
| Flooding in Con Cuong in August 2018. Photo: Document |
To proactively prevent, prevent and limit damage caused by heavy rain, high intensity rain, prolonged rain causing flooding, flash floods, landslides occurring in many areas of the province during the coming rainy and stormy season. In the immediate future, Nghe An needs to proactively build a map of flooding; areas prone to flash floods, landslides... in detail, specifically based on historical data summarized by the hydrometeorological sector and the provincial Flood and Storm Prevention Command over the past many years.
From that map, localities can monitor the announcements of the provincial Flood and Storm Prevention Command, the forecasts of the Hydrometeorological Station on daily and period rainfall, the potential for flooding in which areas and the possibility of flash floods occurring in which areas...
All are announced on mass media so that localities and people know in advance and proactively prevent early before major flooding, flash floods, and landslides occur, especially when there is heavy rain accompanied by strong storms.
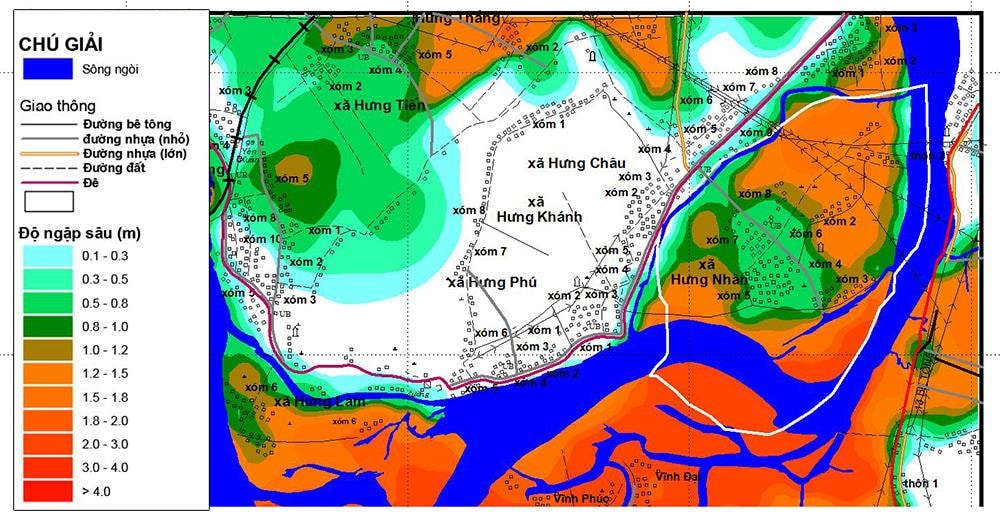 |
| The flood depth map in Hung Nhan commune in 2010 was analyzed by the University of Natural Sciences using mathematical modeling. Photo: danida.vnu.edu.vn |
Flood and flash flood maps are built with 3 specific cases as follows:
Flooding Case 1: Due to heavy rain, strong intensity, large amount of rain, long duration of rain, the consequence will be severe flooding in low-lying areas in coastal plains, riverbanks, stream banks, and basins in mountainous districts.
Monitoring over many years shows that: If the rainfall reaches 100 - 120mm, the whole province will have 11,000 - 12,000 hectares of summer-autumn rice and winter-spring crops flooded. If the rainfall reaches 180 - 200mm, 32,000 - 34,000 hectares of rice and many sections of national highways and provincial roads passing through this area will be submerged in water. If the rainfall reaches 300mm or more, both fields and houses in low-lying areas in coastal plain districts and basin areas in mountainous districts will be submerged in water.
Particularly in mountainous districts, where there are large basins surrounded by mountains and forests with high slopes, it is easy for floodwaters to concentrate quickly. Not only that, the stream bed is narrow, creating a bottleneck that blocks trees flowing from upstream, obstructing the flow, creating a natural dam and causing flash floods and landslides to arise from here.
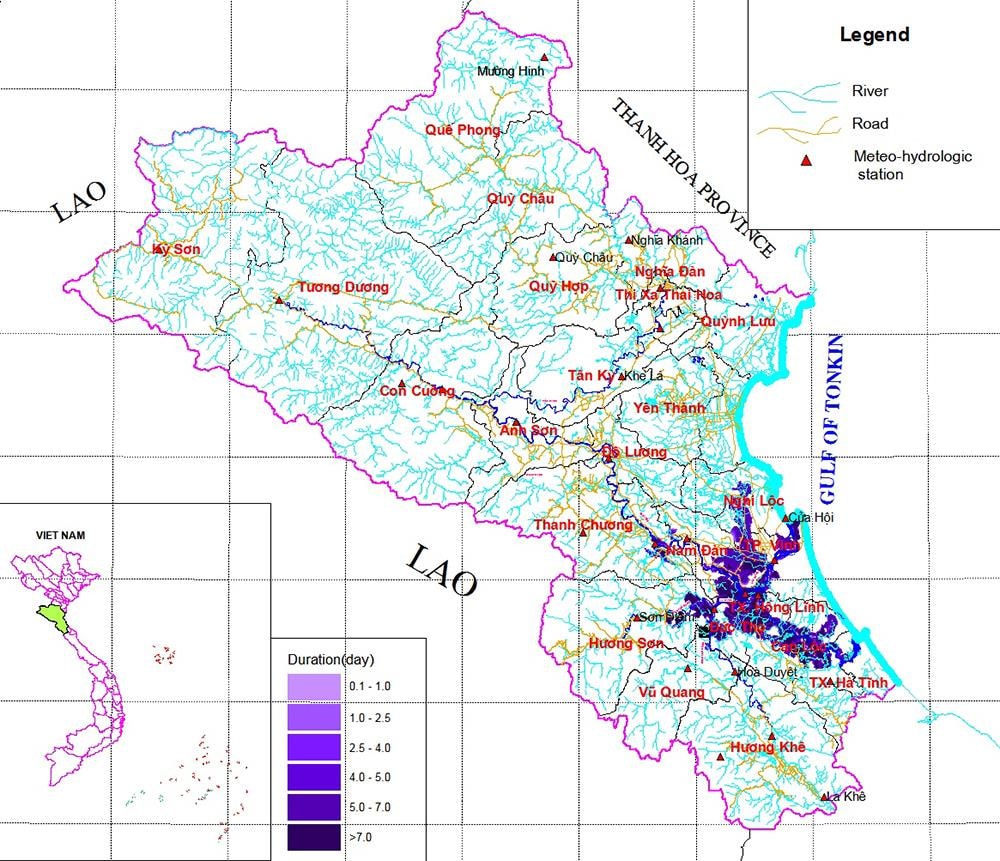 |
| Flood time map on Lam River basin (flood in October 2010) simulated by University of Natural Sciences. Photo: danida.vnu.edu.vn |
Second flood case:Flooding due to flood discharge or dam breakage can be caused in large irrigation dams such as: Vuc Mau Lake in Hoang Mai Town, Ve Rung Dam in Yen Thanh, Khe Go Dam in Nghi Loc, Mu Da Dam in Do Luong, Song Sao Dam in Nghia Dan... and flooding caused by flood discharge in hydroelectric dams such as Ban Ve and Khe Bo hydroelectric reservoirs...
The third flood case: Due to rising sea levels when super typhoons occur. This case is less likely to occur, but should not be taken lightly.
Because in recent years, climate change has increased the phenomenon of super storms, extreme and unpredictable. If a super storm occurs, the flooded area due to rising sea levels can rise to 8-10m and the affected area is the coastal area, riverside to the right of the storm center.
Building a map of flooding and areas where flash floods and flash floods may occur needs to be really detailed. To do so, the mapping agency, the provincial flood and storm prevention steering committee, must coordinate with the provincial hydrometeorological station, the flood and storm prevention committee of districts, cities and towns and the Department of Agriculture and Rural Development of districts, cities and towns to have historical data over many years in each locality and the whole province on flooded areas, scale of flooded areas, level of flooding, time of flooding, consequences of flooding due to excessive rainfall, flood discharge from irrigation dams, flood discharge from hydroelectric dams, dam breaks or flash floods and flash floods (the consequences are counted in how many products of trees, animals, how many houses, how much other property and how many people died...).
The levels of damage are compared with historical data on rainfall measured on each day, each rain period, each storm that directly or indirectly caused heavy rain, all available at Nghe An Hydrometeorological Station.
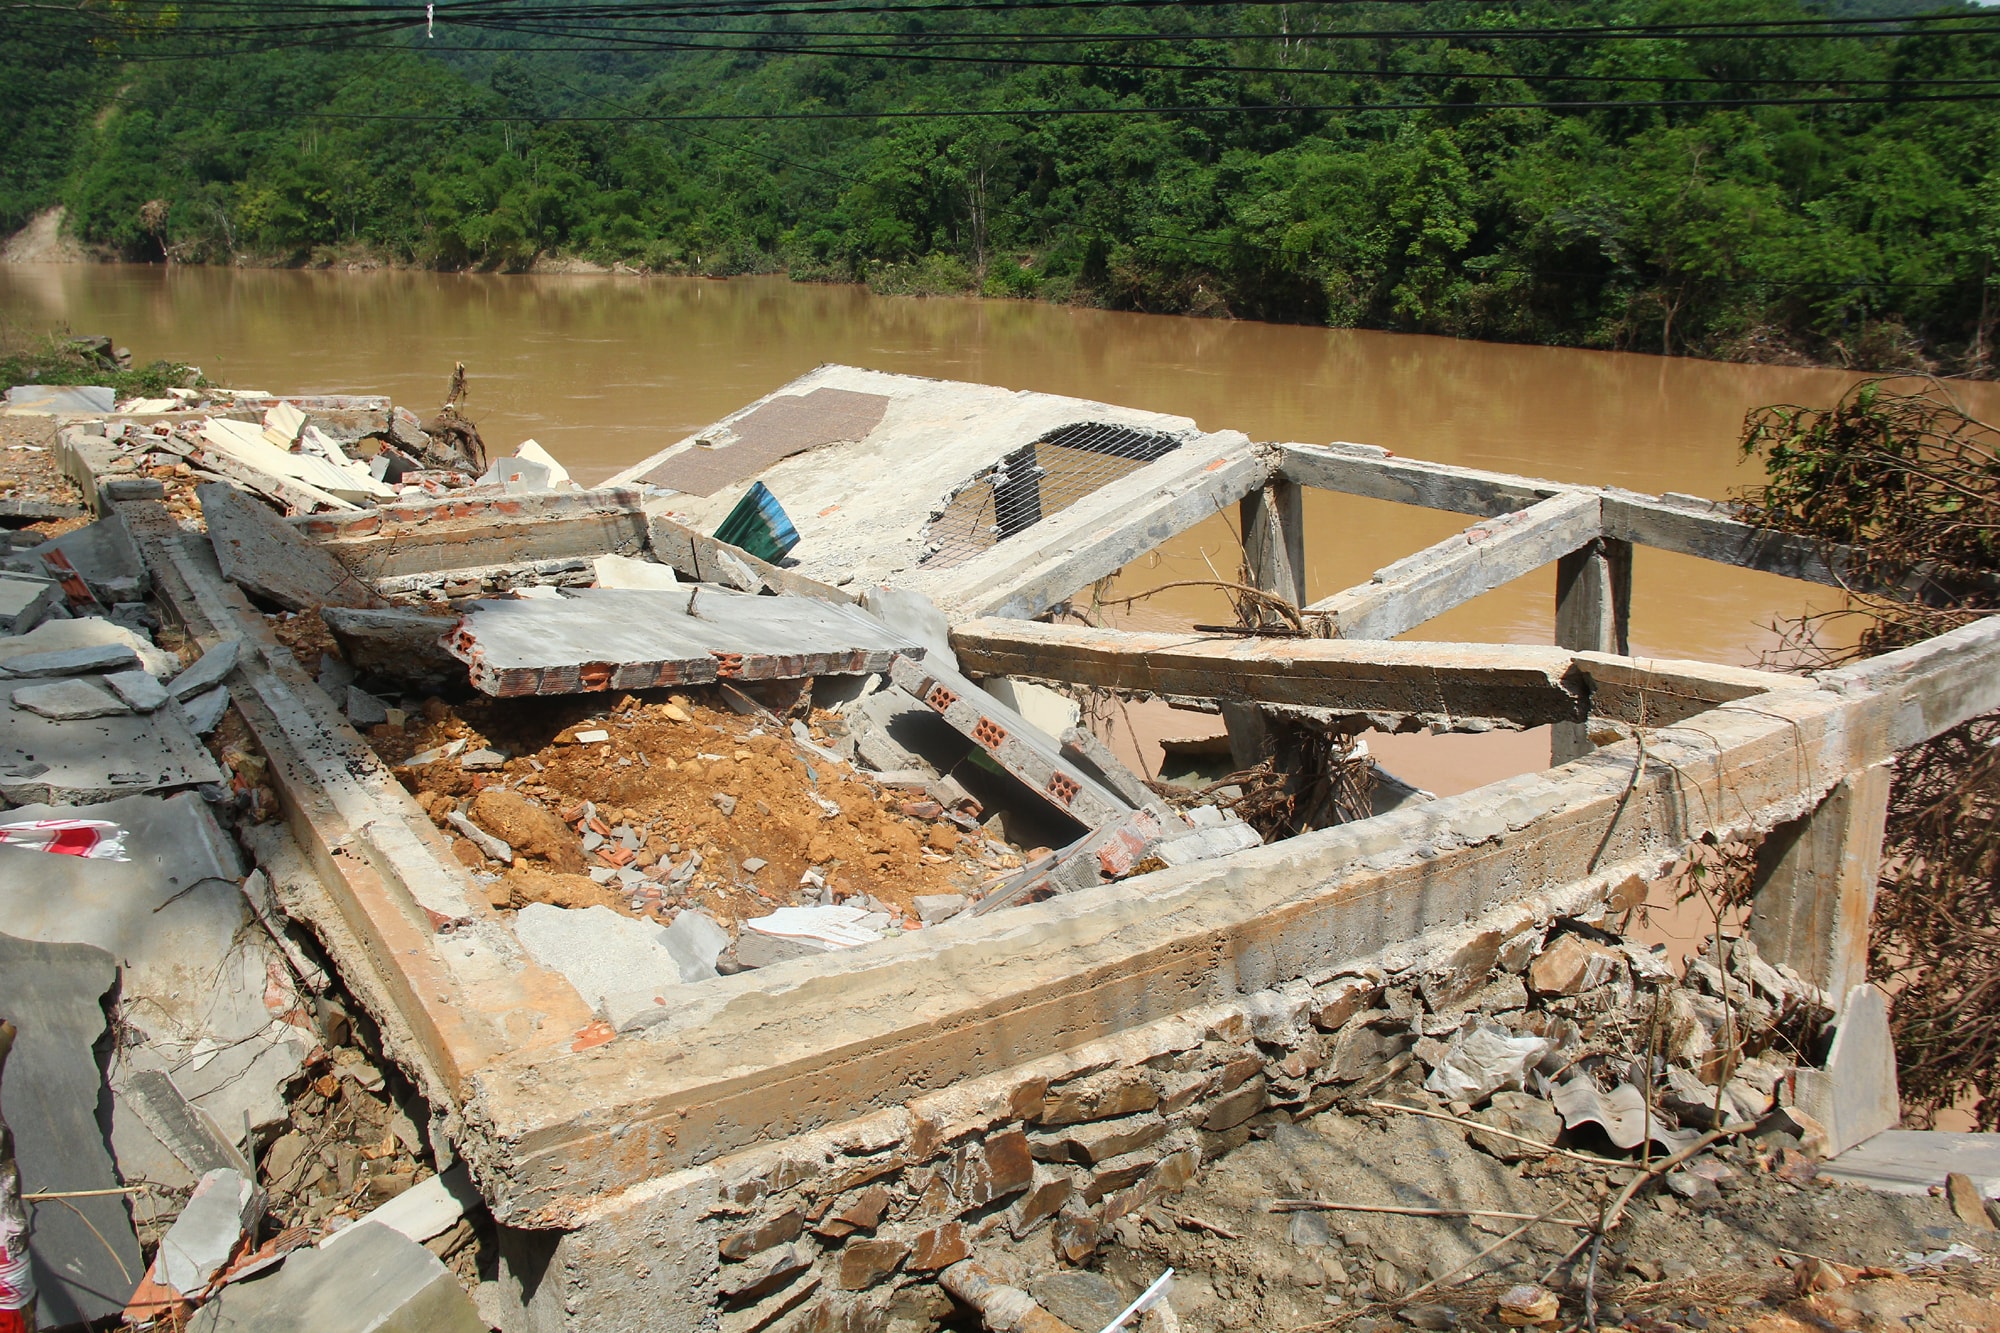 |
| Ban Ve Hydropower Plant's flood discharge caused great property damage in 2018. Photo: Document |
About flood discharge level with discharge volume in m3The level of flood that occurs downstream is historically recorded in irrigation and hydroelectric dams, and the level of damage caused by each flood discharge is included in local reports.
Building a map of inundation, flash floods and landslides during the storm season in our province is a necessary task, should be done and will certainly be done to help the province and localities proactively direct storm and flood prevention work with the highest efficiency, in the current increasingly complex, extreme and unpredictable weather conditions.