
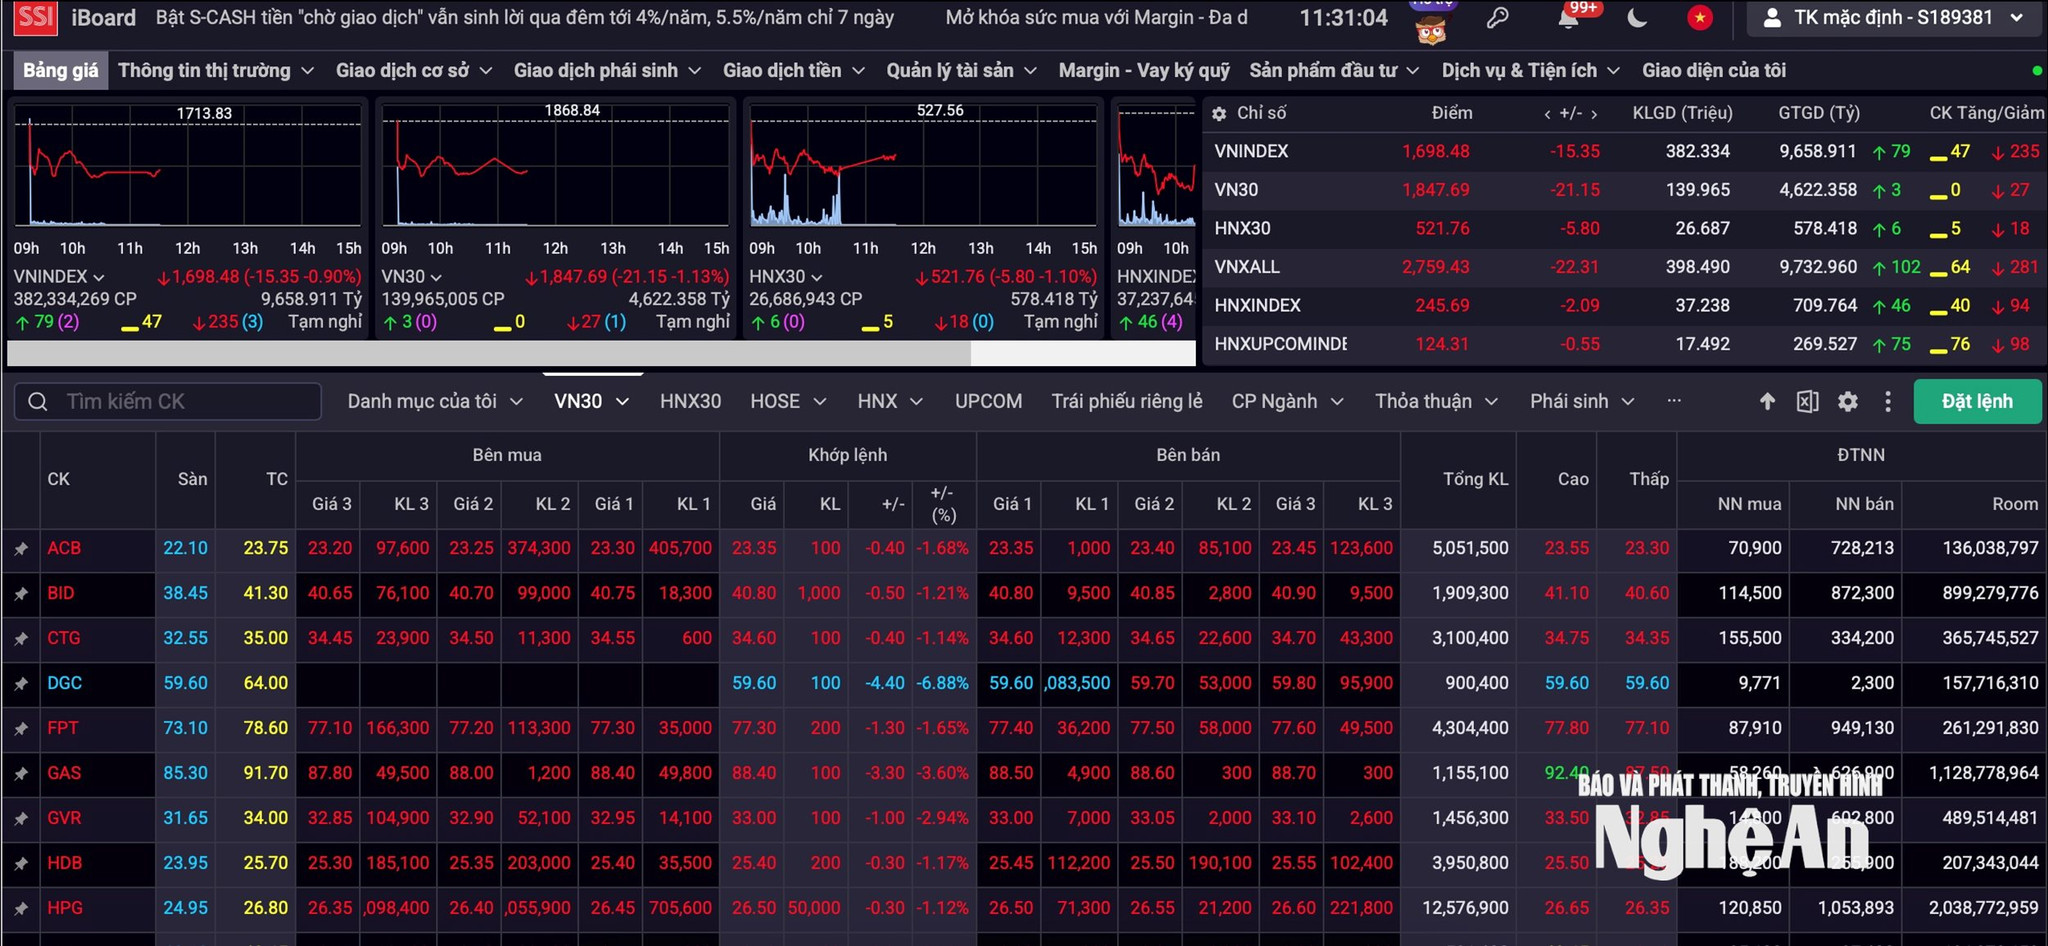
Following the Fed's interest rate decision, the VN-Index fell by 15.35 points.
The Vietnamese stock market closed the trading session on March 19th with a decrease of 15.35 points in the VN-Index, following the decline in global markets, after news that the US Federal Reserve (Fed) decided to keep interest rates unchanged.
At the end of the morning session on March 19th, the VN-Index fell 15.35 points to 1,698.48 points (-0.9%) compared to the previous session. Similarly, other indices such as the HNX-Index fell to 245.69 points (-0.84%), equivalent to 2.09 points, and the UPCoM-Index fell to 124.31 points (-0.44%), equivalent to 0.55 points.
The market was dominated by red, with oil and gas stocks experiencing sharp declines, including PLX (-5.06%), OIL (-0.57%), PVS (-2.33%), PVD (-1.75%), and GAS (-3.6%). This trend was also observed in chemical stocks, with GVR (-2.94%), LAS (-1.6%), DPR (-2.4%), VTZ (-0.5%), and CSV (-1.04%). The only bright spot was PAT - Vietnam Phosphorus Apatite Joint Stock Company, which rose by 11.03%.
Similarly, in the financial services sector, many large-cap stocks such as SSI (-3.04%), VCK (-4.43%), VCI (-2.08%), SHS (-2.47%), and HCM (-2.1%) also declined. Along with these were stocks in the banking sector such as VCB (-1.32%), MBB (-0.76%), VPB (-1.56%), TCB (-0.66%), and ACB (-1.66%).
According to statistics, in the VN30 group, only 3 stocks increased, notably VIC (+1.16%), while 26 stocks decreased, with DGC - Duc Giang Chemical Group Joint Stock Company (-6.88%) continuing to fall to the floor price.
Total market liquidity reached over 9,658 billion VND with nearly 308,000 shares traded.
From a technical perspective, experts at Vietcombank Securities Company believe that the VN-Index closed the trading session with a doji candlestick pattern and a relatively long upper shadow, reflecting strong selling pressure in the market at the end of the afternoon session on March 18th.
On the daily chart, the MACD and RSI indicators are generally moving sideways, while the CMF indicator continues to remain below zero and trending downwards, indicating significant short-term profit-taking pressure at the current price level.
In the short term, the VN-Index is expected to need a few sessions to absorb selling pressure around the 1,700-1,710 point range.
On the hourly chart, the general index is closely following the upper boundary of the Bollinger Bands and is moving in a sideways, small-amplitude range.
Technical indicators are generally trending sideways or slightly upward, suggesting that the VN-Index still has the potential to rise. However, it is also necessary to note the possibility of intraday fluctuations within the 1,680-1,720 point range.
According to experts from Kien Thiet Vietnam Securities Company, the VN-Index maintained its positive trend for the second consecutive session, although the increase was not significant. Similar to the previous session, liquidity remained low, with the trading volume still 27.5% lower than the 20-day average.
The index was strongly boosted in the early morning session by the largest-cap stocks, namely banks, but the lack of inflow of capital caused the upward momentum to falter.
The VN-Index is still in a consolidation channel and there are no signals confirming a new uptrend. Therefore, we continue to maintain a cautious stance, not rushing to open new buying positions, and patiently waiting for clearer confirmation signals.
On the global market, at the close of trading on March 18, US stocks experienced a sharp correction, with the Dow Jones index falling 768.11 points (-1.63%) to 46,225.15 points. The S&P 500 index fell 91.39 points (-1.36%) to 6,624.70 points. The Nasdaq Composite index fell 327.11 points (-1.46%) to 22,152.42 points. The pan-European STOXX 600 index fell 0.75% to 597.93 points.