Statsmodels: Run R linear regression directly in Python
Explore the statsmodels library, a tool that allows data analysts to perform linear regression with familiar R syntax and obtain detailed results.
The power of statsmodels in statistical analysis
Python is a popular programming language in the field of statistical analysis thanks to its rich library ecosystem. Among statistical techniques, linear regression is one of the most widely used methods. The statsmodels library provides powerful tools for performing regression and analysis of variance, especially useful for those already familiar with the syntax of the R language.
StatsModels is a Python library specifically designed for performing statistical tests. This library is particularly powerful in regression analysis, similar to methods used in econometrics. A major advantage of StatsModels is that its results have been cross-checked for accuracy with other professional statistical software such as R, Stata, and SAS, ensuring high reliability for academic and in-depth research.
Simple linear regression with R-style syntax.
Simple linear regression is used to determine the relationship between a dependent variable (y) and an independent variable (x). With statsmodels, users can easily do this using formula syntax similar to that in R.
First, you need to import the necessary libraries:
import statsmodels.formula.api as smf
import statsmodels.api as sm
import seaborn real sns
import numpy as np
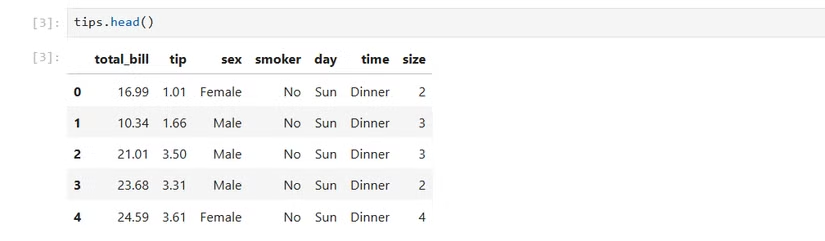
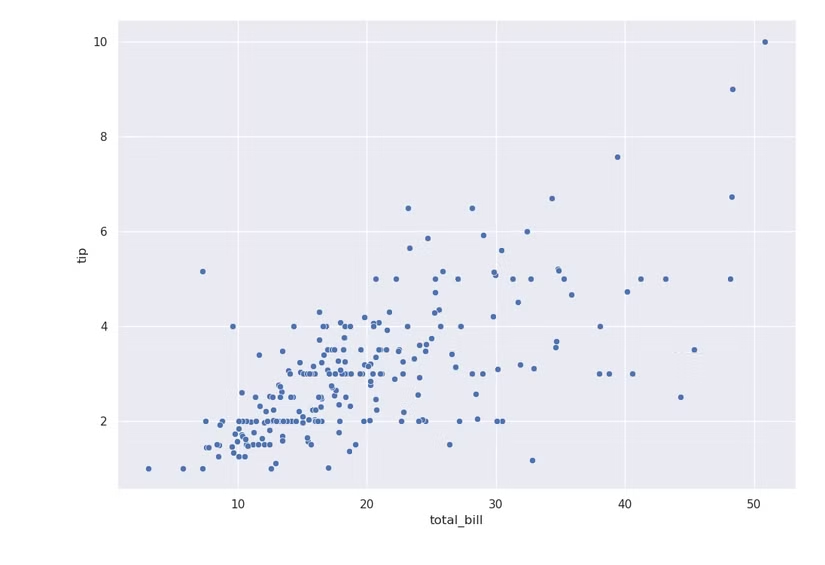
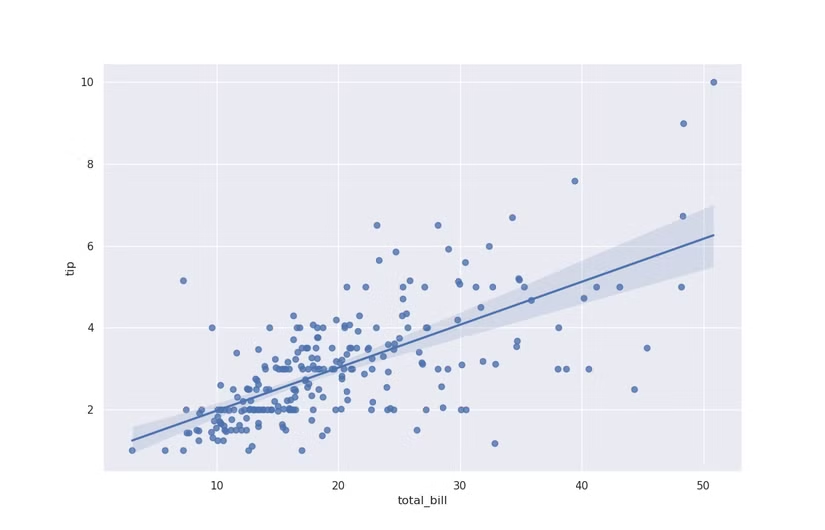
Use the 'tips' dataset available in the Seaborn library to analyze the relationship between tips ('tip') and total bill ('total_bill').
tips = sns.load_dataset('tips')
To fit the regression model, we use the functionsmf.olsOrdinary Least Squares (ordinary least squares) with the following formula syntax:
results = smf.ols('tip ~ total_bill', data=tips).fit()
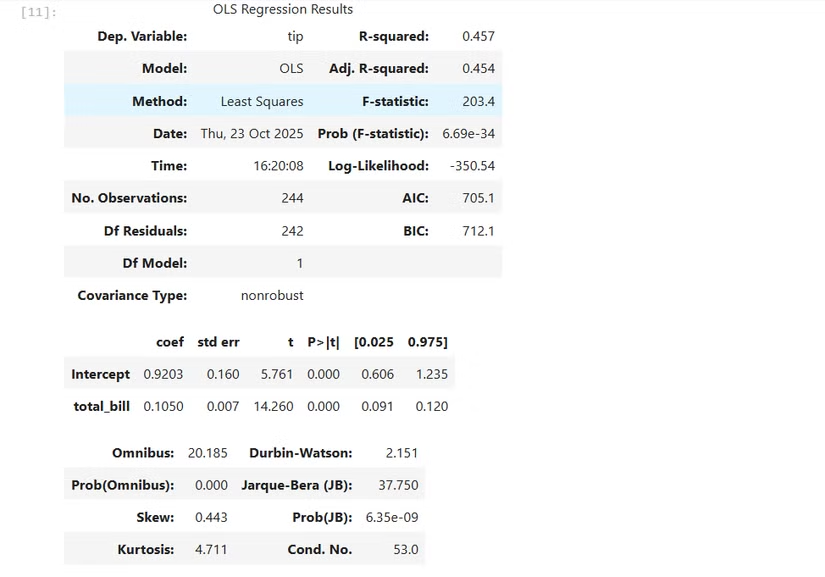
In this case, 'tip ~ total_bill' specifies 'tip' as the dependent variable and 'total_bill' as the independent variable. To view the detailed results of the model, use the command:
print(results.summary())
Expanding to multivariate regression and nonlinear models
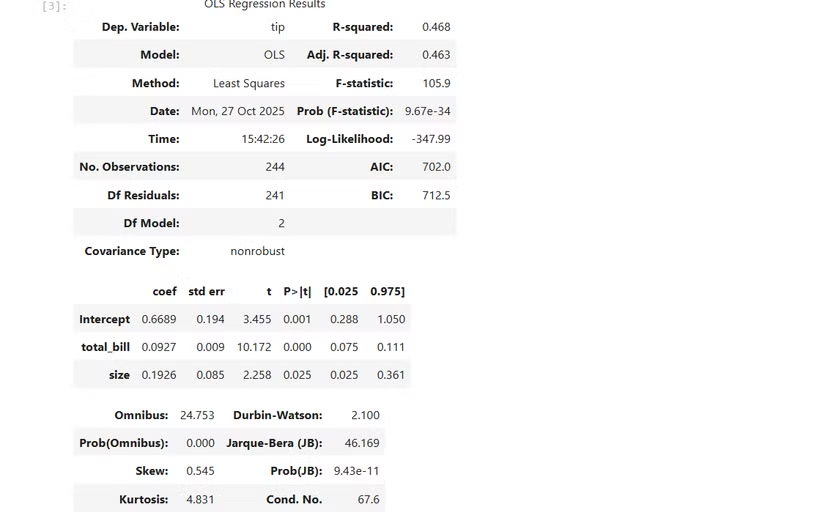
Multiple linear regression allows for the analysis of the relationship between the dependent variable and multiple independent variables, helping to control for potential confounding variables. The syntax in statsmodels is very simple; just add new variables to the formula using the plus sign (+).
For example, to consider the impact of both the total bill and the size of the party on the tip:
results = smf.ols('tip ~ total_bill + size', data=tips).fit()
print(results.summary())
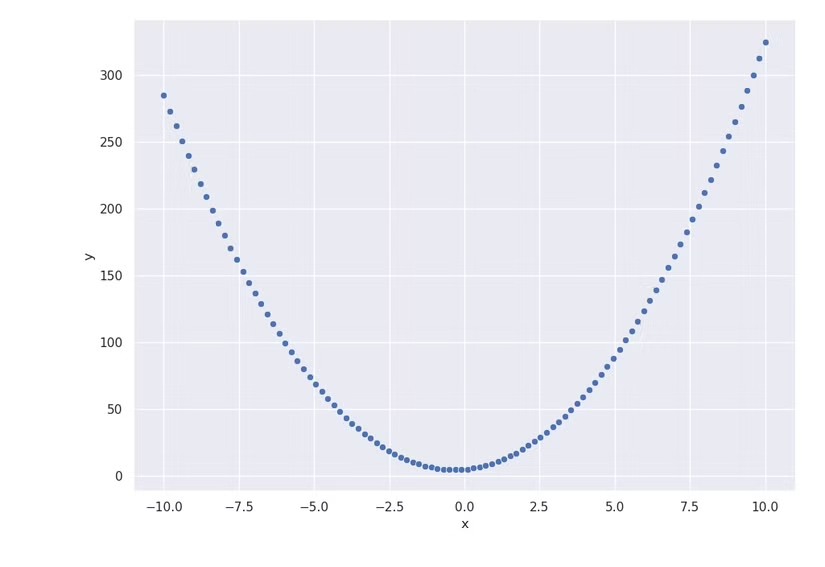
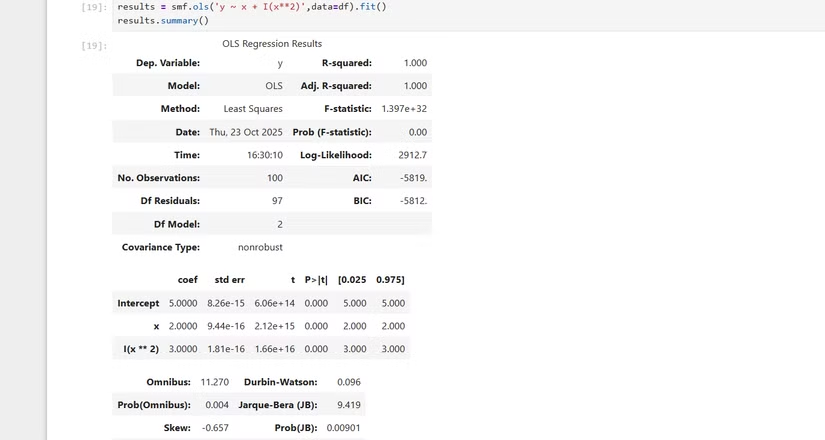
Additionally, statsmodels also support modeling nonlinear relationships, such as quadratic equations. The following function needs to be used:I-AuxTo inform statsmodels that this is an operation on an existing variable:
results = smf.ols('y ~ x + I(x**2)', data=df).fit()
print(results.summary())
Decoding the regression results table
The summary table of results from statsmodels provides a lot of important information for evaluating the model:
- R-squared (Coefficient of determination):This indicates the degree to which the variability of the dependent variable is explained by the independent variables. The closer the value is to 1, the better the model fits.
- Adjusted R-squared:Similar to R-squared but adjusted for the number of variables in the model, it is more useful when comparing multivariate regression models.
- Coefficients:This indicates the degree of change in the dependent variable when the corresponding independent variable changes by one unit.
- Std err (Standard Error):Measure the accuracy of the estimated coefficient. The lower the value, the more reliable the estimate.
- p-value:This is used to test the statistical significance of each variable. If the p-value is less than a predetermined threshold (usually 0.05), the variable has a statistically significant effect.
Analysis of Variance (ANOVA)
Analysis of variance (ANOVA) is used to compare the mean values of a variable across multiple groups of a categorical variable.
One-way ANOVA
When there is only one categorical variable, we use one-way ANOVA. For example, to test whether penguin species ('species') is a significant predictor of beak length ('bill_length_mm'):
penguin_lm = smf.ols('bill_length_mm ~ species', data=penguins).fit()
results = sm.stats.anova_lm(penguin_lm)
print(results)
Multidimensional ANOVA
When there is more than one categorical variable, we can use multiplex ANOVA. For example, add the island variable to the model:
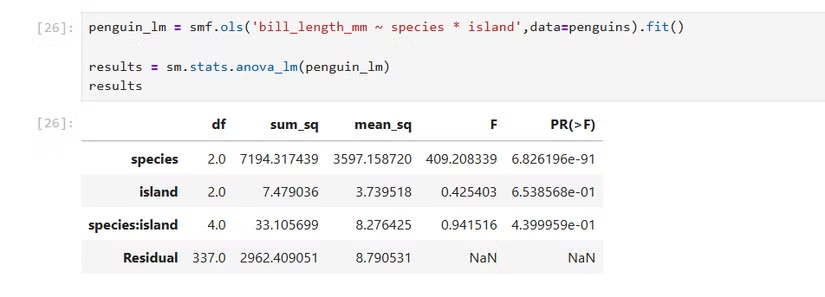
penguin_multi_lm = smf.ols('bill_length_mm ~ species * island', data=penguins).fit()
results = sm.stats.anova_lm(penguin_multi_lm)
print(results)
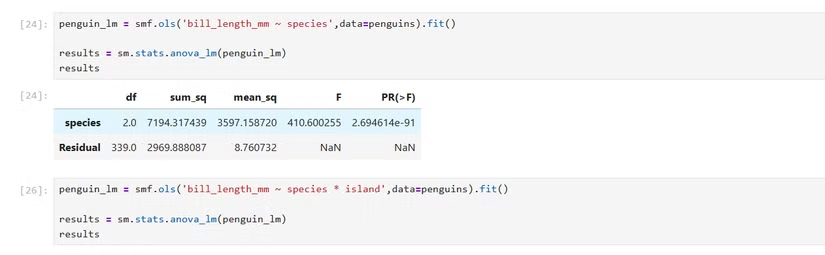
The use of asterisks (*) in the formula allows the model to consider both the individual effects of each variable and the interactions between them.
Conclude
The statsmodels library provides the ability to perform complex statistical models such as linear regression and ANOVA directly within the Python environment. By using familiar R-style formula syntax, statsmodels simplifies the process of building and analyzing models, enabling data scientists and analysts to transform raw data into insights and evidence-based decisions.