Signs of recovery from oil and gas and chemical stocks.
The Vietnamese stock market continued its recovery in today's session (March 18th), with the VN-Index rising 3.08 points (+0.18%) to 1,713.37 points.
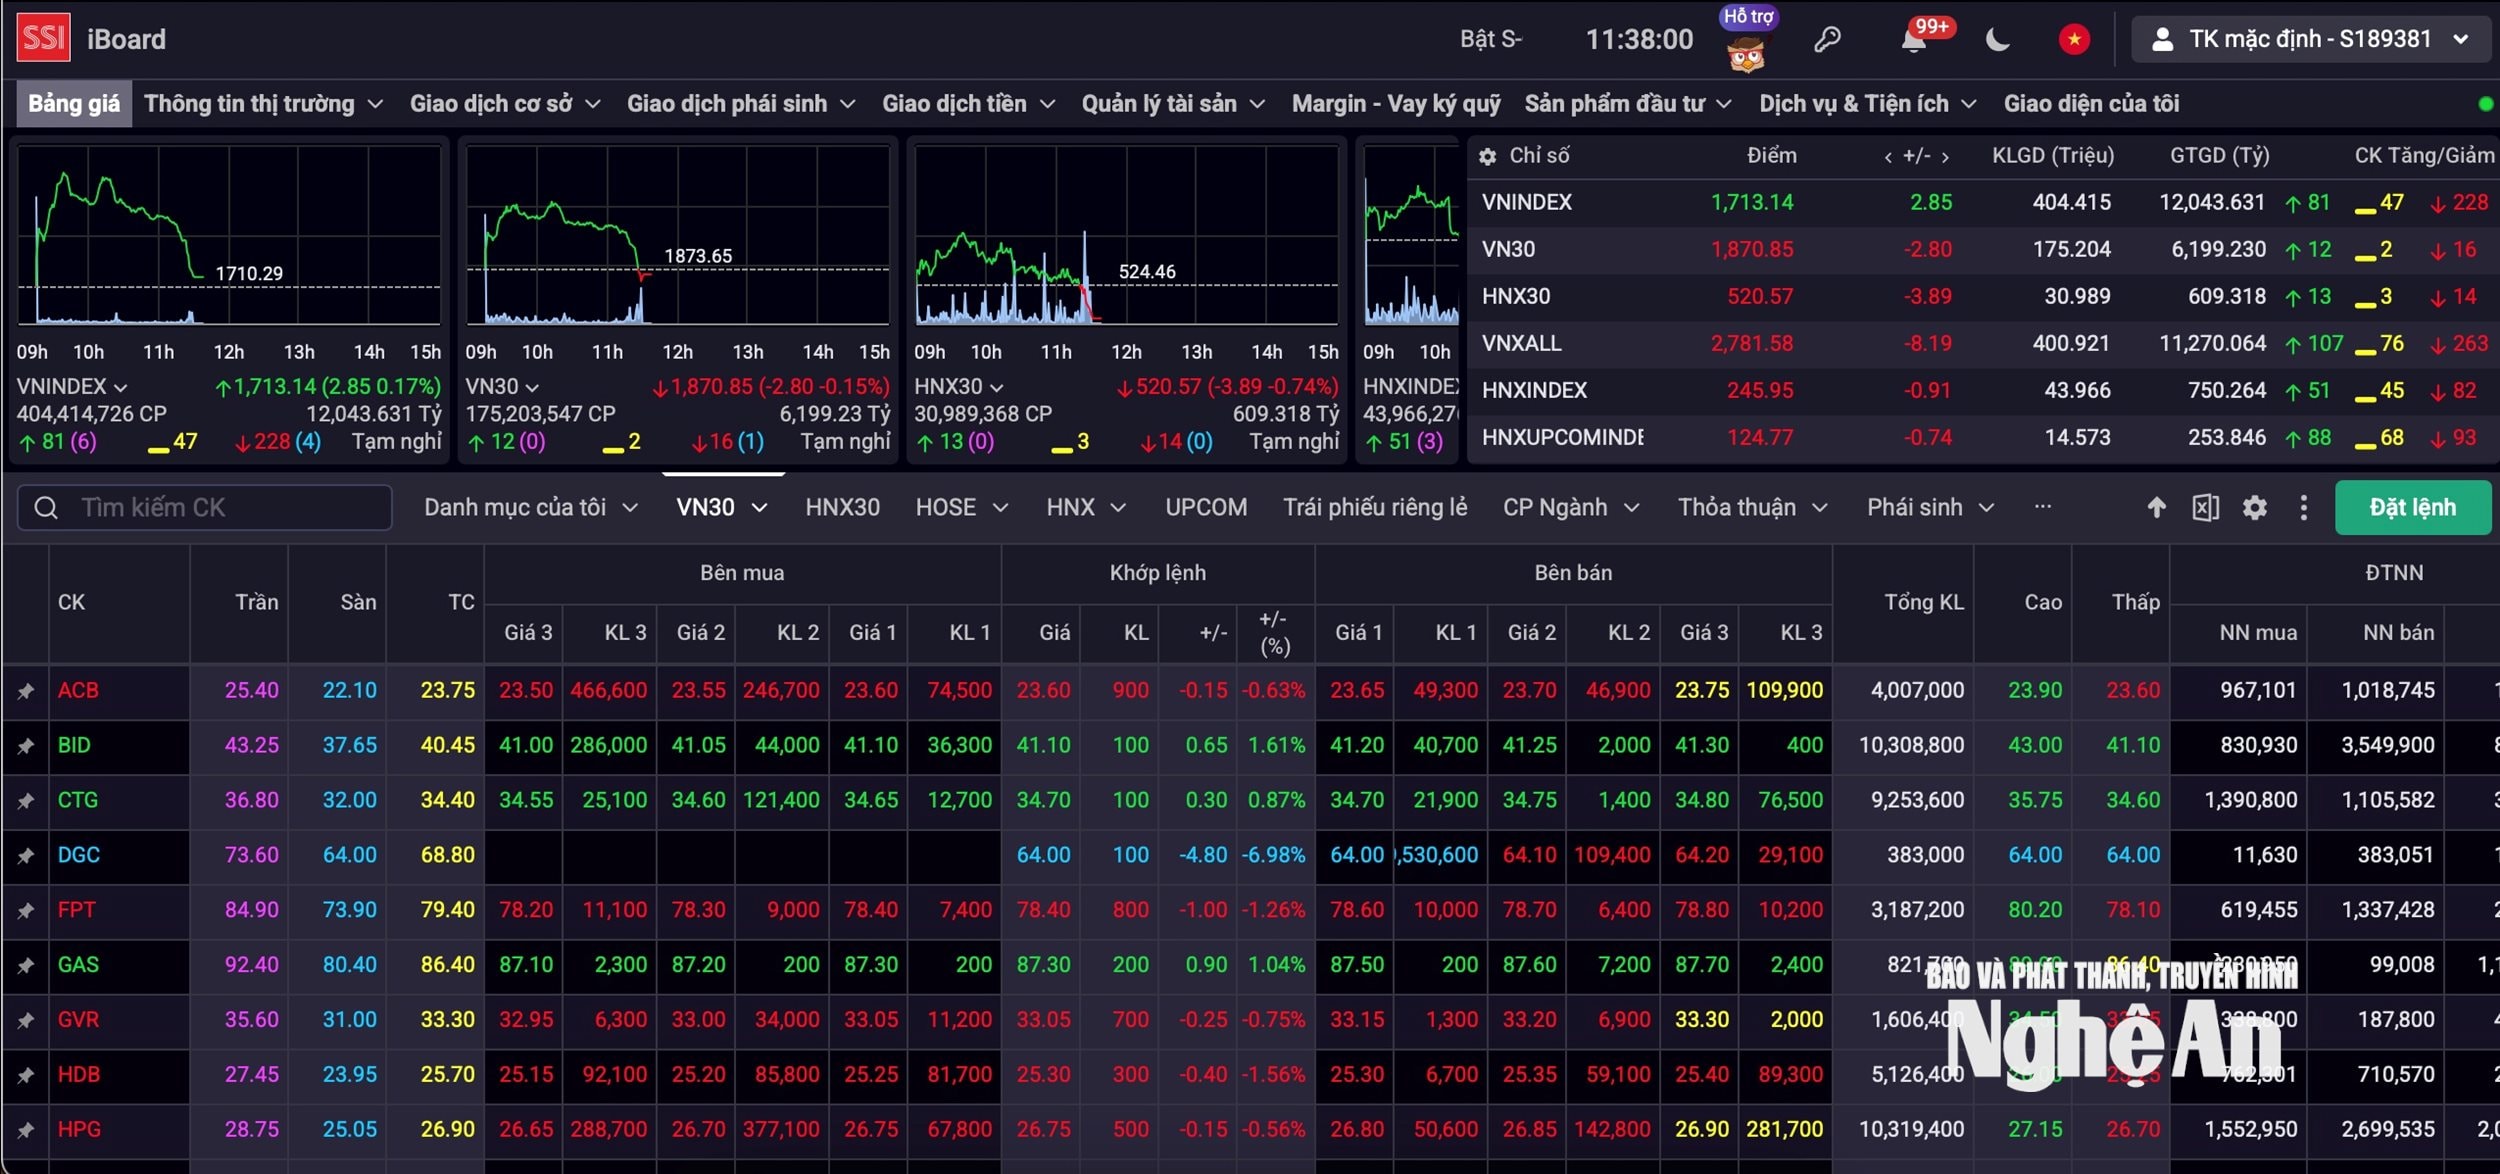
At the end of the morning session on March 18th, the VN-Index rose by more than 3 points, reaching 1,713.37 points (+0.18%) compared to the previous session. Meanwhile, indices such as the HNX-Index recorded a decrease to 245.95 points (-0.37%), equivalent to 0.91 points, and the UPCoM-Index decreased to 124.77 points (-0.59%), equivalent to 0.74 points.
In the oil and gas sector, stocks recorded slight gains, with PVD (+0.72%), PTV (+1.47%), PVB (+0.33%), POS (+1.81%), and PVS (+0.5%). Additionally, the two leading stocks in the sector, GAS (+1.04%) and PLX (+2.19%), also showed signs of recovery after several sessions of decline.
Similarly, the real estate sector also recorded gains with VIC (+4.99%), VHM (+0.78%), and VRE (+0.38%).
Conversely, the financial services sector recorded a sharp decline, with many large-cap stocks such as SSI (-2.44%), VCK (-6.3%), VCI (-4.3%), SHS (-2.41%), and HCM (-2.91%). This was also followed by stocks in the banking sector such as STB (-4.73%), VCB (-0.5%), EIB (-0.06%), HDB (-1.56%), and MBB (-0.76%).
According to statistics, within the VN30 group, 12 stocks increased, 17 stocks decreased, and only DGC - Duc Giang Chemical Group Joint Stock Company (-6.98%) fell to the floor price.
Total market liquidity reached over 12,043 billion VND with nearly 405,000 shares traded.
From a technical perspective, experts at Vietcombank Securities Company believe that the VN-Index closing the March 17th session with a Gravestone Doji candlestick indicates strong selling pressure in the afternoon session.
On the daily chart, the RSI indicator continues to trend upwards, consistent with the market's recovery in recent sessions.
The MACD histogram has started trending upwards but is still in negative territory, not yet confirming a trend reversal; it is still a short-term consolidation phase for the index.
The nearest support zone is identified around the MA200 line, equivalent to 1,640 points, and the nearest resistance is around 1,745 points, equivalent to the market's most recent previous bottom.
On the hourly chart, the RSI indicator has reversed upwards, suggesting that selling pressure has temporarily subsided.
However, the -DI line continues its upward trend and crosses the +DI line, but there is no consensus with the ADX line, so overall, the current trend of the index is still to consolidate around the 1710 point level.
Provide recommendations,Experts from AIS Securities Company stated that...The VN-Index recorded a slight recovery after a series of previous fluctuations, successfully regaining the psychological level of 1,700 points.
Currently, the market may experience some further rebounds and minor recoveries, with the nearest resistance level at 1,740-1,750 points (equivalent to the 20-week moving average).
If the index doesn't regain this level soon, the current correction trend is unlikely to end, and the VN-Index will most likely return to test the 1,650-point support zone.
Investors should only hold stocks with strong fundamentals and positive earnings growth prospects in Q1 2026. Sell some stocks that are weakening in price.